Remko Weijnen's Blog (Remko's Blog)
About Virtualization, VDI, SBC, Application Compatibility and anything else I feel like
There has long been a debate about how to accurately view the size of your Citrix Provisioning Services ram cache size. SO much so that even Citrix clarified on how to view this detail using yet another tool
The thing is, this is all fine and well, but it’s a bit of a pig to actually get this data when you need it, or in an automated way. Wouldn’t it be better if we could have something easier?
Lately, Andrew Morgan and I decided to sit down and create an easy to use, Windows performance counter for the key metrics in a PVS cache and provide them to the community for use.
These counters turned out to be fascinating, as they really show how the cache works.
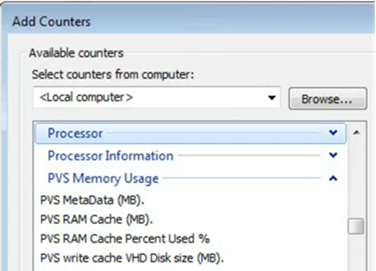
Our latest counters (which can be downloaded below) provide the following counters for easy access:
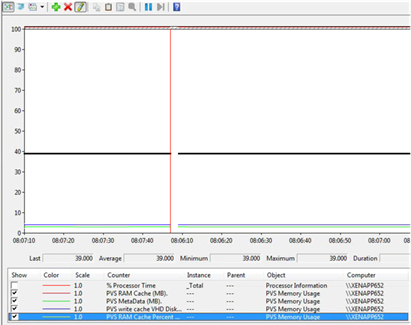
- PVS Ram cache size (MB)
- PVS metadata size (MB)
- PVS Write Cache VHD disk size (MB)
- PVS Ram Cache Percent used. *
* As there is no accurate way to detect how much ram is assigned to cache via Citrix Provisioning services, this value must be provided or this performance counter is missing.
The end result, is a simple MSI. Install this MSI on your PVS target golden image and when the image is in “Cache in RAM, overflow to disk” the performance counters will appear in perfmon as below:
The Service on start-up will check the cache type and if correct, the counters will be created an update every 500 MS. On service stop, the counters will be deleted. Simple stuff.
These counters are available in library form, should you wish to implement these counters in your own monitoring solution. Please reach out directly If you would like them.
In order for the “PVS RAM Cache Percent Used %” to appear. You must define the following registry value:
HKEY_LOCAL_MACHINE\SOFTWARE\PVSCOUNTER
Type: REG_SZ
Name: CacheSizeMB
Value: e.g. 1024
Download:
You can find a download link here.
Profile
Top Posts
- Query Active Directory from Excel
- RNS 510 Startup Logo–My thoughts
- Adding a hidden Exchange mailbox to Outlook
- How rdp passwords are encrypted
- Get Actual CPU Clock Speed with PowerShell
- ClickOnce Applications in Enterprise Environments
- VW RNS 510 Navigation Startup Pictures
- Unattended Installation of IBM System i Access for Windows
- Reading physical memory size from the registry
- Show Client IP Address when using NetScaler as a Reverse Proxy
Recent Comments
Featured Downloads
- AClientFix (13595 downloads )
- AddPrinter2.zip (12854 downloads )
- AdProps (12379 downloads )
- AdSample1 (11432 downloads )
- AMD Radeon Crimson ReLive (25912 downloads )
- Atheros Driver (34019 downloads )
- AutoLogonXP 1.0 (11404 downloads )
- CDZA (9560 downloads )
- ChDrvLetter.zip (11217 downloads )
- ChDrvLetter.zip (14356 downloads )
Blogroll
- Andrew Morgan
- Arnout’s blog
- Assa’s Blog
- Barry Schiffer
- Delphi Praxis
- Ingmar Verheij
- Jedi Api Blog
- Jedi API Library
- Jeroen Tielen
- Kees Baggerman
Categories
- .NET (4)
- Active Directory (28)
- Altiris (36)
- App-V (1)
- Apple (5)
- Application Compatibility (11)
- Automotive (5)
- AWS (1)
- BootCamp (1)
- C# (6)
- C++ (2)
- Citrix (87)
- Delphi (61)
- Embedded (4)
- Exchange (16)
- General (71)
- iPhone (5)
- Java (8)
- Linux (1)
- Lync (2)
- NetScaler (1)
- Oracle (4)
- Other (1)
- Packaging (19)
- PowerShell (56)
- Programming (79)
- Quest (1)
- RES (7)
- script (22)
- ShareFile (1)
- SQL Server (10)
- Strange Error (3)
- Terminal Server (68)
- ThinApp (3)
- ThinKiosk (1)
- Ubuntu (1)
- Unattended Installation (19)
- Uncategorized (51)
- UWP (2)
- Vista (37)
- Visual Studio (1)
- VMWare (26)
- Windows 10 (2)
- Windows 2003 (30)
- Windows 2008 (37)
- Windows 2008 R2 (16)
- Windows 2012 (2)
- Windows 7 (30)
- Windows 8 (4)
- Windows Internals (12)
- Windows XP (16)
Archives
- February 2023 (1)
- October 2022 (3)
- July 2022 (1)
- June 2022 (2)
- October 2019 (1)
- March 2018 (1)
- January 2018 (4)
- December 2017 (3)
- April 2017 (1)
- March 2017 (5)
- February 2017 (4)
- May 2016 (3)
- March 2016 (1)
- October 2015 (2)
- September 2015 (1)
- January 2015 (1)
- August 2014 (1)
- July 2014 (8)
- May 2014 (1)
- November 2013 (1)
- October 2013 (2)
- September 2013 (3)
- August 2013 (4)
- June 2013 (2)
- May 2013 (3)
- April 2013 (5)
- March 2013 (5)
- February 2013 (1)
- January 2013 (5)
- December 2012 (9)
- November 2012 (3)
- October 2012 (3)
- August 2012 (4)
- July 2012 (2)
- June 2012 (1)
- May 2012 (6)
- March 2012 (13)
- February 2012 (12)
- January 2012 (9)
- December 2011 (9)
- November 2011 (4)
- October 2011 (5)
- September 2011 (10)
- August 2011 (10)
- July 2011 (2)
- June 2011 (8)
- May 2011 (12)
- April 2011 (4)
- March 2011 (14)
- February 2011 (8)
- January 2011 (32)
- December 2010 (23)
- November 2010 (19)
- October 2010 (10)
- September 2010 (6)
- August 2010 (1)
- July 2010 (1)
- June 2010 (6)
- March 2010 (7)
- February 2010 (3)
- December 2009 (3)
- November 2009 (11)
- September 2009 (2)
- July 2009 (1)
- June 2009 (5)
- May 2009 (1)
- April 2009 (2)
- March 2009 (3)
- February 2009 (6)
- January 2009 (3)
- December 2008 (8)
- November 2008 (5)
- October 2008 (3)
- September 2008 (3)
- August 2008 (3)
- June 2008 (6)
- May 2008 (2)
- April 2008 (3)
- March 2008 (5)
- January 2008 (3)
- December 2007 (3)
- November 2007 (13)
- October 2007 (10)


6 Responses for "Citrix PVS RAM cache size Performance Counters"
Any chance the monitoring interval is programmable? For our usage this tool is great, but we really wouldn’t need something that checks every 1/2 second, once a minute would suffice for our purposes.
This looks awesome- can’t wait to try it out.
I would agree on the monitoring interval though, not sure if that level of granularity is needed (unless it doesn’t make a difference for performance/space consumed… then… who cares?)
I’m sure the next call will be to see how to have this data easily available in the PVS console, but one step at a time 🙂
The polling interval is set in this way as performance counters will (when observed) tick every one second. If you find that there is a negative performance impact (I didn’t see one in my testing) let me know and I’ll update it to allow it be tuned.
Hi ! On https://www.remkoweijnen.nl/blog/contact/ i get this message: Contact Form Shortcode Error: Form 1 does not exist.
Great idea with Citrix PVS RAM cache size Performance Counters. After installing, adding reg-keys and starting the service PVS Memory appears as performance counters but PVS Memory Usage is at 0,000. Do have any idea?
Hi Joe, thanks for letting me know about the contact form, I’ll look into it!
Re the performance counters -> what PVS version are you running?
i have PVS 7.6
Leave a reply